Last Mile Delivery Cost Calculator
Estimate Your Delivery Costs
Calculate estimated costs for your last-mile delivery based on order volume, distance, and delivery model.
Enter your values and click Calculate to see estimated costs.
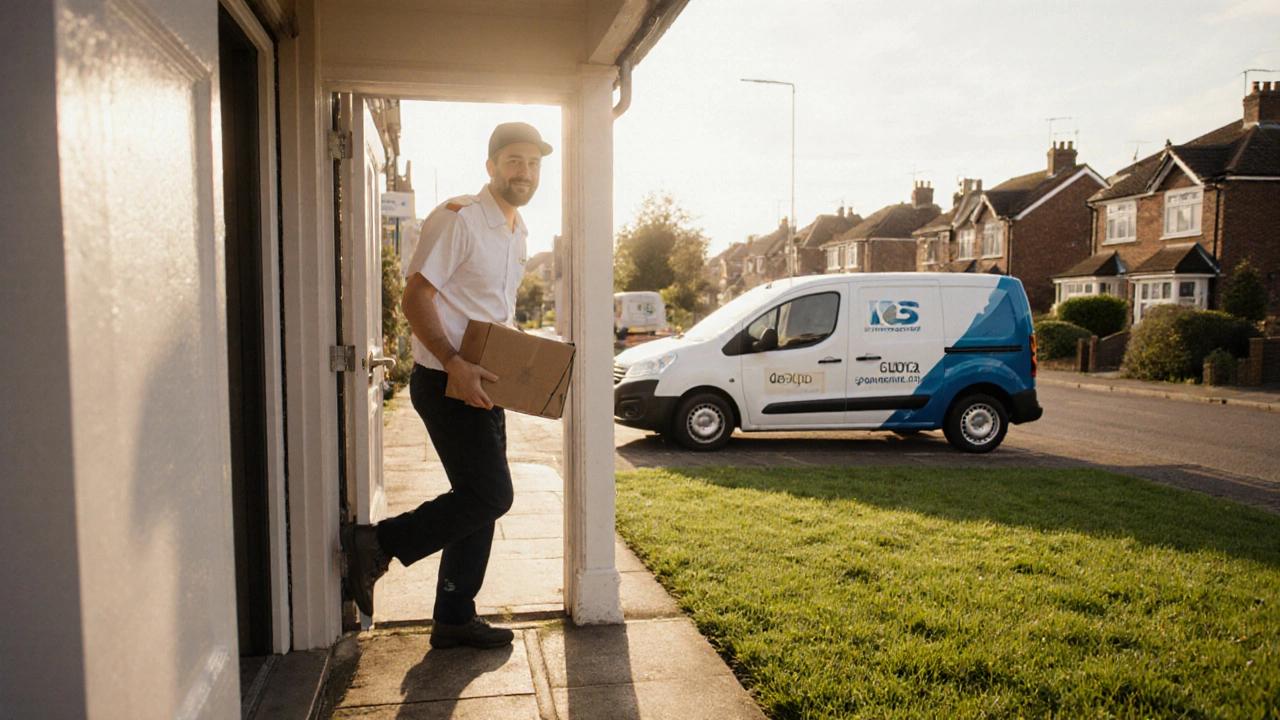
When you hear the term Last Mile Delivery is the final leg of the shipping journey that moves a product from a nearby hub or fulfilment centre straight to the customer’s address, you instantly picture a courier stepping onto the porch with a parcel. That short stretch - often just a few kilometres - packs the biggest cost, the highest risk of delay, and the strongest impact on how customers feel about a brand.
Key Takeaways
- Last mile delivery accounts for 50‑60% of total shipping costs in many markets.
- Speed, reliability and the experience at the doorstep shape repeat purchase rates.
- Technology - routing software, real‑time tracking and delivery‑specific vehicles - can shave hours off a delivery window.
- Choosing between in‑house, third‑party and crowdsourced models depends on order volume, geography and brand control.
- A simple checklist of route planning, communication and proof of delivery helps avoid the most common pitfalls.
What Exactly Is Last Mile Delivery?
In plain language, last mile delivery is the movement of goods from the closest distribution point to the end consumer. It begins once a package leaves a local warehouse, a retail store’s back‑room, or a city‑level fulfilment centre. It ends when the customer signs for, or otherwise confirms receipt of, the item.
Key attributes of this phase include:
- Distance: Typically under 30km, but can be longer in suburban or rural zones.
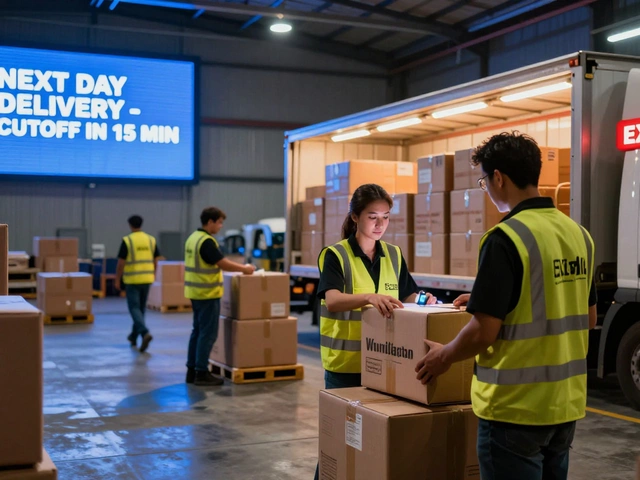
- Time Sensitivity: Customers often expect same‑day or next‑day delivery, making speed essential.
- Cost Structure: Labour, fuel, vehicle depreciation and failed‑delivery reimbursements dominate the expense sheet.
Because the final hand‑off is visible to the buyer, any hiccup - a missed address, a late arrival, or a damaged package - instantly shapes the brand’s reputation.
Why Does Last Mile Matter to E‑commerce?
The rise of online shopping turned shipping from a background cost into a competitive weapon. A recent survey of 2,500 shoppers in Australia and NewZealand showed that 68% would abandon a purchase if delivery took longer than three days, and 45% said a poor delivery experience made them switch brands.
In the e‑commerce ecosystem, last mile delivery influences three critical metrics:
- Customer Satisfaction (CSAT): On‑time, intact deliveries boost CSAT scores by up to 22%.
- Repeat Purchase Rate: Brands that consistently meet promised windows see a 15‑30% lift in repeat orders.
- Operational Margins: Streamlining the final leg can shave 5‑10% off total logistics costs, directly improving profit margins.
For retailers, the decision isn’t just about speed - it’s about balancing cost, control and brand perception.
Common Challenges on the Final Stretch
Even with advanced planning, several obstacles keep popping up:
- Address Accuracy: In NewZealand, roughly 12% of rural deliveries involve incorrect or incomplete addresses.
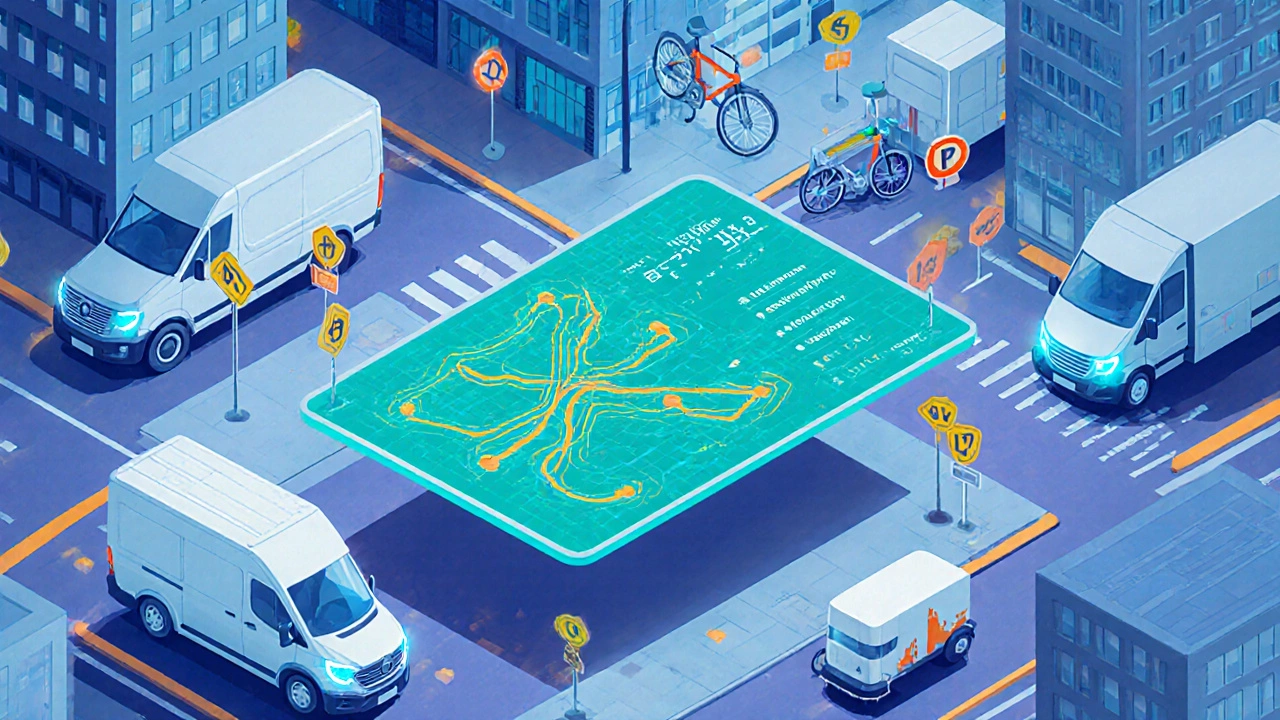
- Traffic Congestion: Auckland’s central business district experiences an average of 35% slower travel times during peak hours.
- Failed Attempts: The global average of failed first‑delivery attempts sits at 22%, each costing the retailer an additional $7‑$12 in re‑delivery fees.
- Cold‑Chain Requirements: Perishable goods need temperature‑controlled vehicles, adding complexity and expense.
- Environmental Pressure: Consumers increasingly demand greener delivery options, pushing firms toward electric fleets or bike couriers.
Addressing these issues requires a mix of technology, process design and strategic partnerships.
Delivery Models: In‑House vs Third‑Party vs Crowdsourced
Choosing the right delivery model hinges on order volume, geographic spread and brand control. Below is a quick side‑by‑side view.
| Aspect | In‑House Fleet | Third‑Party Carrier | Crowdsourced Platform |
|---|---|---|---|
| Control over brand experience | Highest - drivers wear company livery, messaging is consistent | Medium - carrier follows own SOPs, limited customization | Variable - depends on platform standards |
| Scalability | Limited by fleet size and hiring speed | High - can tap existing national networks | Very high - surge capacity during peaks |
| Cost per parcel (average) | $6‑$8 (fuel + driver wages) | $7‑$10 (carrier rate + markup) | $5‑$7 (platform fee + driver payout) |
| Technology integration | Full API control, real‑time tracking | Depends on carrier’s API maturity | Usually app‑based, limited customization |
| Regulatory compliance | Full responsibility for driver licensing, vehicle inspections | Carrier handles compliance, but you remain liable | Platform screens drivers, but oversight is lighter |
For many mid‑size retailers, a hybrid approach works best: keep a small in‑house team for premium zones while leveraging third‑party carriers for broader coverage.
Technology Enablers That Reduce Friction
Technology is the secret sauce that turns a chaotic delivery operation into a predictable service.
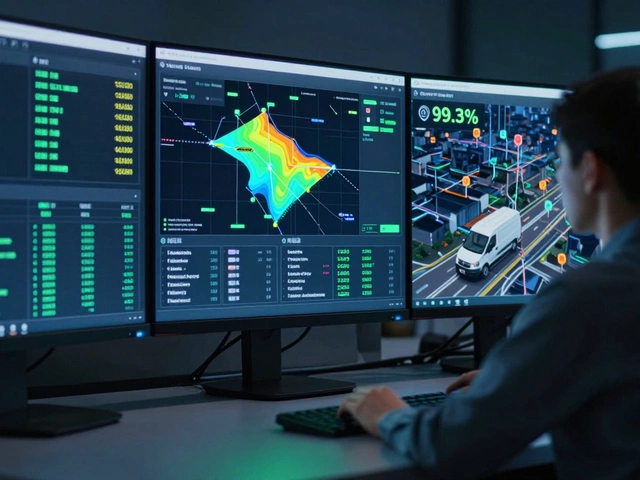
Route Optimization Software is an algorithmic tool that calculates the most efficient sequence of stops, factoring traffic, vehicle capacity and delivery windows. Companies that adopted dynamic routing saw a 12% reduction in mileage and a 9% cut in fuel usage.
Real‑time tracking platforms - often built on GPS and cellular networks - give shoppers a live map, boosting transparency and reducing missed‑delivery calls by up to 30%.
Proof‑of‑delivery (PoD) methods have evolved from simple signatures to photo capture, barcode scanning and even biometric verification. PoD not only settles disputes faster but also provides valuable data for performance analytics.
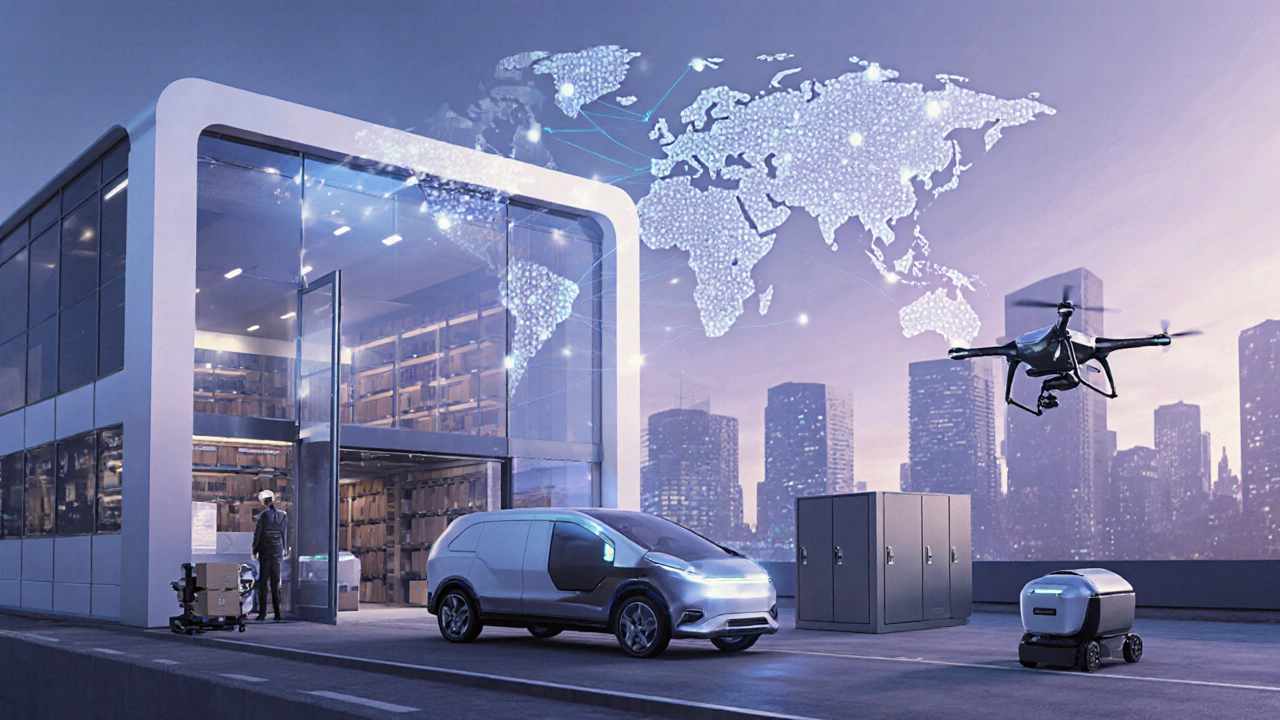
Emerging tools like autonomous delivery robots and drone pilots are still niche, but early adopters in urban Auckland report a 15% speed gain for low‑weight parcels during off‑peak hours.
Best‑Practice Checklist for a Smooth Final Leg
- Validate Addresses Early: Use an address‑verification API at checkout to catch typos before the package leaves the warehouse.
- Segment Orders by Delivery Mode: Flag high‑value or temperature‑sensitive items for in‑house handling; route the rest through third‑party carriers.
- Leverage Dynamic Routing: Update routes every 5‑10 minutes based on live traffic data.
- Communicate Proactively: Send SMS or push notifications with exact delivery windows and a link to live tracking.
- Offer Flexible Delivery Options: Click‑and‑collect, locker pick‑up, or evening windows reduce failed attempts.
- Capture Proof of Delivery: Photo of the doorstep or QR‑code receipt to confirm hand‑off.
- Monitor KPIs Daily: Track on‑time delivery rate, cost per mile, and customer satisfaction scores.
- Iterate with Data: Use analytics to identify repeat problem zones (e.g., a suburb with many missed addresses) and adjust processes.
Following this checklist can turn a pricey, error‑prone operation into a competitive edge.
Future Trends Shaping the Last Mile
Looking ahead to 2026 and beyond, three trends are set to reshape the landscape:
- Electrification: New Zealand aims for 50% of urban delivery fleets to be electric by 2030, driving down fuel costs and emissions.
- Micro‑fulfilment Hubs: Small, city‑center warehouses enable same‑hour delivery for fast‑moving SKUs.
- AI‑Powered Demand Forecasting: Predictive models allocate drivers before orders even arrive, smoothing workload spikes.
Retailers that experiment with these innovations now will likely secure a larger share of the next‑generation e‑commerce market.
Frequently Asked Questions
What distance does "last mile" actually cover?
In practice, last‑mile spans anywhere from a few hundred metres in dense city blocks to about 30km in suburban or semi‑rural zones. The key factor is that it is the final step before the package reaches the consumer.
How much of the total shipping cost is typically due to the last mile?
Industry studies show that 50‑60% of total logistics costs are incurred during the last‑mile segment, especially for same‑day or next‑day services.
Is it better to use an in‑house fleet or outsource to a carrier?
There’s no one‑size‑fits‑all answer. In‑house fleets give the most brand control but are cost‑intensive to scale. Third‑party carriers provide breadth and flexibility at the expense of direct oversight. Many businesses adopt a hybrid model to balance cost, control and coverage.
What technology gives the biggest ROI for last‑mile optimization?
Dynamic route‑optimization software typically delivers the highest return, reducing mileage by 10‑15% and cutting fuel spend. Pairing it with real‑time tracking and automated customer notifications further boosts satisfaction.
How can retailers reduce failed delivery attempts?
Key steps include address verification at checkout, offering precise delivery windows, sending proactive notifications, and providing alternate drop‑off options such as lockers or curbside pick‑up.
