
Excel vs. Inventory Software Decision Tool
Enter your details to get started
Fill out the assessment form to receive personalized recommendations for your inventory management needs.
Imagine it’s Tuesday morning. You have a rush order waiting to be packed. You open your Excel is a widely used spreadsheet application developed by Microsoft that allows users to organize, analyze, and store data in tabular form. file, scroll past three months of sales records, and realize you’re out of stock on your best-selling item. Or worse, you think you have ten units, but the warehouse only has two. This scenario is the nightmare of any small business owner relying on manual tracking.
The short answer to "Can Excel track inventory?" is yes. It absolutely can. But the longer, more important question is: *should* you? For a solo entrepreneur with five SKUs, Excel is perfect. For a growing e-commerce brand handling fifty products across multiple channels, it might be the thing holding you back from scaling.
In this guide, we’ll break down exactly how to build an effective inventory system in Excel, where it starts to fail, and when it’s time to graduate to dedicated logistics software. We’ll look at real formulas, common pitfalls, and the hidden costs of doing things manually in 2026.
How to Build a Basic Inventory Tracker in Excel
If you are just starting out, you don’t need expensive software. You need structure. The key to making Excel work for inventory is moving away from a single, messy sheet and towards a structured database approach.
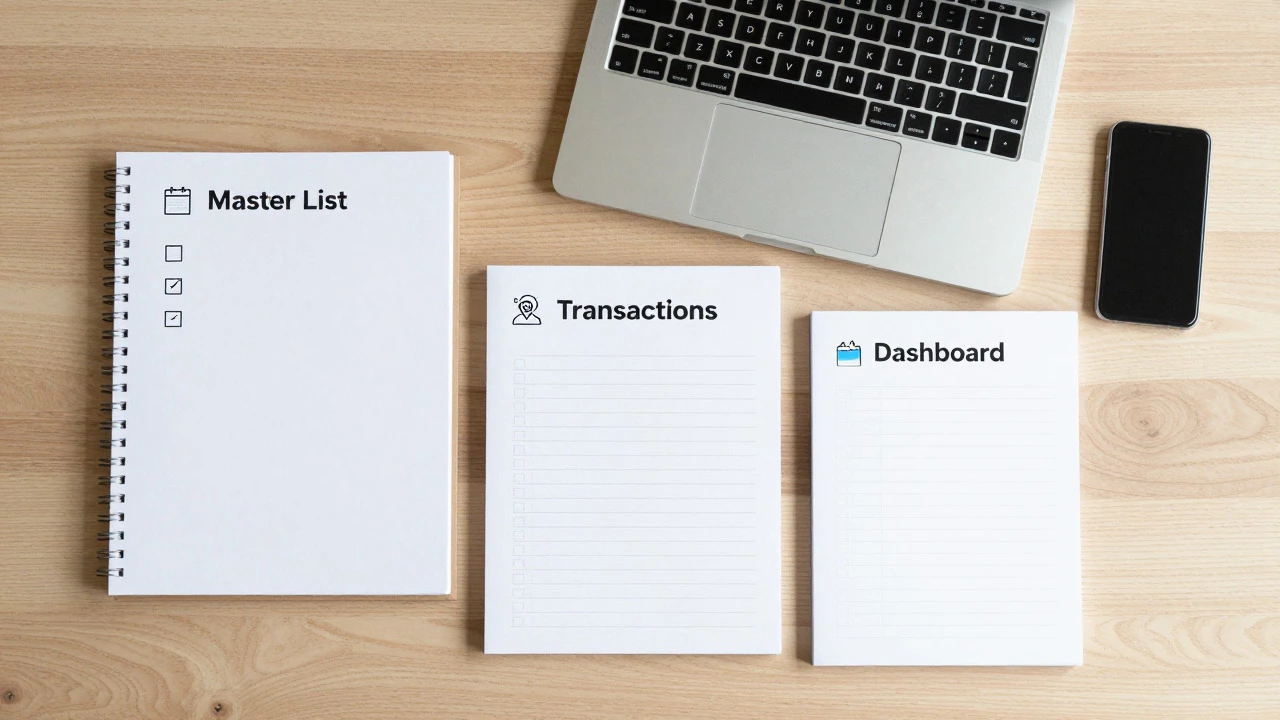
Start by creating three separate tabs (sheets) in your workbook:
- Master Product List: This is your source of truth. Include columns for SKU (Stock Keeping Unit), Product Name, Category, Supplier, Cost Price, and Selling Price.
- Inventory Transactions: Every time you receive stock or sell an item, log it here. Columns should include Date, SKU, Transaction Type (In/Out), Quantity, and Reference Number (like a purchase order or invoice ID).
- Current Stock Dashboard: This sheet pulls data from the other two to show you what you have right now.
Why separate them? Because if you try to edit quantities directly in a list, you lose your history. If you sell five widgets today, you want to know that happened on July 14th, not just see the number drop from 50 to 45 without context.
The Magic Formula: SUMIFS
To make your dashboard work, you need to calculate current stock based on transactions. The formula you will use most often is SUMIFS. It adds up numbers based on specific criteria.
Here is how you calculate current stock for a specific SKU:
=SUMIFS(Transactions!D:D, Transactions!B:B, A2, Transactions!C:C, "In") - SUMIFS(Transactions!D:D, Transactions!B:B, A2, Transactions!C:C, "Out")
This formula looks at the Transactions sheet. It sums all quantities where the SKU matches the product and the type is "In", then subtracts all quantities where the type is "Out". It’s simple, powerful, and accurate-if you remember to log every single movement.
Advanced Features: Making Excel Work Harder
Once you have the basics down, you can add features that mimic basic inventory software. These tricks help prevent errors and save time.
Data Validation for Consistency
Human error is the biggest risk in manual tracking. One person types "Widget Red," another types "Red Widget." Excel sees these as two different products. To fix this, use Data Validation.
Go to the Data tab, select Data Validation, and choose "List." Link the source to your Master Product List. Now, when someone enters a transaction, they must pick the SKU from a dropdown menu. No more typos, no more duplicate entries.
Conditional Formatting for Low Stock Alerts
You don’t want to wait until you run out to reorder. Set up a reorder point for each item (e.g., reorder when stock hits 10 units). Use Conditional Formatting to highlight cells in red if the current stock is below this threshold.
This visual cue acts as an early warning system. While it doesn’t automatically place an order like some logistics platforms do, it ensures you never miss a critical restock window.
Pivot Tables for Insights
As your transaction log grows, raw data becomes hard to read. Pivot Tables allow you to summarize thousands of rows in seconds. You can quickly answer questions like:
- Which products sold the most last month?
- How much inventory value do I hold in total?
- What is my average monthly sales volume per SKU?
These insights are crucial for forecasting demand and negotiating better terms with suppliers.
The Hidden Costs of Manual Tracking
Excel is free if you already have Microsoft 365, but it’s not cost-free. The price comes in the form of time and risk. Let’s look at where spreadsheets start to struggle.
Single Point of Failure
If your laptop crashes, or you accidentally delete the wrong row, your entire inventory record could be gone. Unless you have rigorous backup protocols (saving versions daily to cloud storage), one mistake can wipe out weeks of work. Dedicated inventory software stores data in the cloud with automatic backups, reducing this risk significantly.
No Real-Time Syncing
Imagine you sell a product online. Your website updates instantly. But your Excel file? It stays the same until you manually update it. If two people are working on the same file simultaneously-say, one receiving stock and another processing sales-you can easily overwrite each other’s changes. This leads to "phantom inventory," where you think you have stock that doesn’t exist.
Lack of Automation
In 2026, automation is expected, not optional. Modern logistics software integrates directly with marketplaces like Shopify, Amazon, and eBay. When a sale happens, the inventory count drops automatically. In Excel, you have to export sales reports and manually enter them into your transaction log. This process is tedious and prone to human error.
Scalability Issues
Excel slows down with large datasets. Once you hit tens of thousands of rows, formulas become sluggish. Searching for a specific SKU takes longer. Managing hundreds of SKUs across multiple warehouses becomes a logistical nightmare in a spreadsheet.
| Feature | Excel Spreadsheet | Cloud Inventory Software |
|---|---|---|
| Cost | Low (subscription included) | Monthly fee ($20-$300+) |
| Setup Time | Hours to days | Days to weeks |
| Real-Time Updates | No (manual entry required) | Yes (automatic sync) |
| Multi-User Access | Risky (conflict potential) | Safe (role-based access) |
| Integrations | None (manual import/export) | Native (Shopify, Amazon, etc.) |
| Error Rate | High (human-dependent) | Low (automated) |
When to Stick with Excel
Despite its limitations, Excel remains a powerful tool for specific scenarios. You should stick with Excel if:
- You have fewer than 20 SKUs: Simplicity wins. The overhead of setting up software isn’t worth it.
- You have a single sales channel: If you only sell in-person or through one website, manual updates are manageable.
- Your team is small: One or two people managing the file reduces conflict risks.
- Budget is extremely tight: If cash flow is critical, avoiding monthly SaaS fees makes sense initially.
In these cases, focus on discipline. Create strict protocols for logging transactions. Review your data weekly. Use the advanced features mentioned earlier to minimize errors.
When to Graduate to Logistics Software
Growth brings complexity. It’s time to consider dedicated inventory management systems when:
- You exceed 50 SKUs: Tracking dozens of items manually becomes overwhelming.
- You sell on multiple channels: Syncing inventory between Amazon, Shopify, and a physical store requires automation.
- You have a team: Multiple users need simultaneous access without overwriting data.
- You need barcode scanning: Mobile apps with barcode scanners speed up receiving and picking processes dramatically.
- You want advanced reporting: Automated forecasts, supplier performance metrics, and profit analysis are built into modern platforms.
Popular options include tools like Cin7, TradeGecko (now QuickBooks Commerce), and Zoho Inventory. These platforms integrate with accounting software, shipping carriers, and e-commerce platforms, creating a seamless flow of data.

Best Practices for Hybrid Approaches
You don’t always have to choose one or the other immediately. Many businesses use a hybrid approach during transition periods.
For example, you might use Excel for detailed production planning or custom manufacturing logs, while using dedicated software for sales and shipping. Ensure both systems share a common SKU structure so data can be reconciled periodically.
Another tip: Use Excel as a sandbox for testing new strategies before implementing them in live software. Simulate sales scenarios or test different reorder points without risking actual inventory accuracy.
Common Mistakes to Avoid
Even experienced users fall into traps when managing inventory in spreadsheets. Here are the most frequent ones:
- Hardcoding values: Never type numbers directly into formulas. Always reference cells. This prevents errors if underlying data changes.
- Ignoring audits: Regularly count physical stock and compare it to your Excel records. Discrepancies indicate theft, damage, or logging errors.
- Overcomplicating sheets: Keep it simple. Complex macros and nested formulas break easily. Prioritize clarity over cleverness.
- Failing to back up: Save copies regularly. Use version control if collaborating.
Conclusion: Is Excel Enough for You?
Excel can track inventory effectively for small, simple operations. It offers flexibility, low cost, and immediate availability. However, as your business grows, the limitations of manual tracking become apparent. Errors multiply, time spent on admin increases, and scalability suffers.
The decision isn’t about whether Excel is "good" or "bad." It’s about fit. Evaluate your current needs, project your growth, and weigh the cost of software against the cost of your time. If you’re spending more than five hours a week on inventory tasks, it’s likely time to explore dedicated solutions.
Remember, the goal of inventory management isn’t just counting boxes. It’s ensuring you have the right products, at the right time, to satisfy customers and maximize profit. Choose the tool that helps you achieve that most efficiently.
Can I use Excel for multi-location inventory?
Yes, but it requires careful setup. You would need to add a "Location" column to your transactions and use SUMIFS formulas that filter by both SKU and location. However, this becomes complex quickly. Dedicated software handles multi-location transfers and stock levels natively, reducing error risks.
Is there a free template for Excel inventory?
Microsoft provides several free templates in the Excel app under "Inventory" categories. Additionally, many third-party sites offer downloadable templates. Be cautious with unknown sources due to security risks. Start with Microsoft’s official templates for safety and reliability.
How often should I reconcile my Excel inventory?
Aim for weekly reconciliation for high-value items and monthly for others. Physical counts should match your spreadsheet records. Any discrepancy should be investigated immediately to identify causes such as theft, damage, or data entry errors.
Can Excel generate barcodes?
Yes, Excel can generate barcodes using special fonts (like Code 128 or Code 39) or plugins. You format the cell with the barcode font, and the text converts to a scannable code. However, this is static. For dynamic barcode generation linked to live data, dedicated software is superior.
What is the biggest risk of using Excel for inventory?
The biggest risk is human error leading to inaccurate stock levels. This results in overselling (damaging customer trust) or overstocking (tying up capital). Lack of real-time syncing and audit trails exacerbates these issues, especially as volume grows.