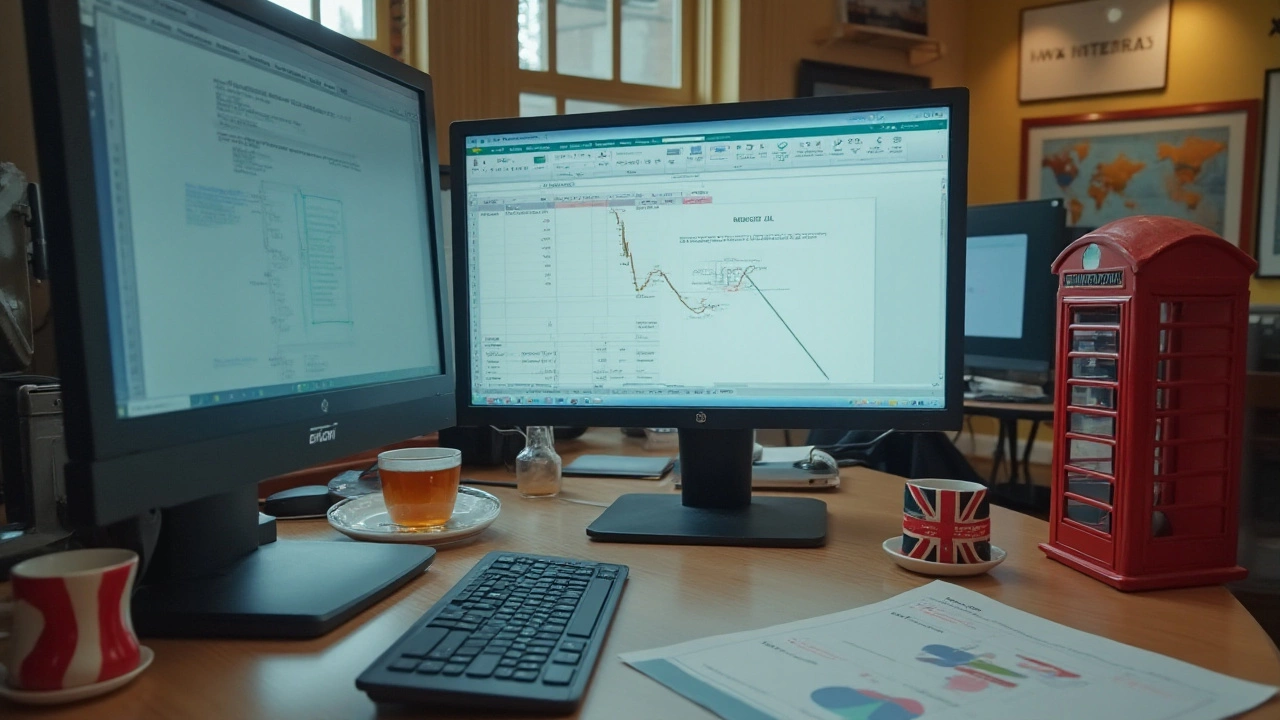
Excel Tutorial: Master Spreadsheets for Logistics and Shipping
If you move boxes, track parcels, or calculate freight costs, Excel is the tool that will keep you organized. You don’t have to be a data scientist – a few core features can turn a messy list into a clear, actionable report. Below you’ll find practical steps you can start using right away.
Getting Started with the Basics
First, open a new workbook and name the sheet after the project, like UK Shipments March 2025. Use the first row for column headers – Order ID, Weight (kg), Destination, Cost (£). When you type the headers, format them with Bold and a background colour so they stand out.
Enter your raw data underneath. Excel will automatically expand the table when you add new rows. To make calculations easy, turn the range into a Table (Ctrl+T). Tables give you auto‑filled formulas, easy sorting, and built‑in filters.
Now add a simple formula. In the Cost (£) column, type =[@Weight]*0.75 if your carrier charges £0.75 per kilogram. Press Enter and the formula copies down the whole column. You’ve just turned a list of weights into a cost sheet without manual math.
Advanced Tricks for Logistics Data
As the dataset grows, you’ll need to summarise it. PivotTables are perfect for this. Select any cell in your table, go to Insert → PivotTable, and place it on a new sheet. Drag Destination to the Rows area and Cost (£) to the Values area. Excel will instantly show you the total shipping cost per city.
What if you want to see the average weight per destination? In the same PivotTable, click the drop‑down under Cost (£), choose Value Field Settings, and switch the aggregation to Average. Now you have both total cost and average weight at a glance.
Conditional formatting helps you spot outliers. Highlight the Cost (£) column, choose Home → Conditional Formatting → Highlight Cells Rules → Greater Than…, and set a threshold, say £200. All high‑cost shipments light up in red, so you can investigate why they’re expensive.
For recurring reports, create a reusable template. Save a workbook with the table structure, formulas, and PivotTable already set up, but leave the data rows empty. Each month, just copy the template, paste your new data, and refresh the PivotTable (right‑click → Refresh). No need to rebuild anything.
Finally, share your insights. Use File → Export → PDF to send a clean report to managers, or click Share → Copy link if you store the file on OneDrive. Everyone gets the same, up‑to‑date numbers without emailing Excel files back and forth.
With these basics and a few advanced tricks, Excel becomes a reliable partner for any logistics operation. Keep experimenting – add VLOOKUP or XLOOKUP to pull rates from a separate price list, or use data validation to prevent entry errors. The more you use it, the more efficient your shipping workflow will be.
January 12, 2025
Evelyn Wescott
0 Comments
Learning how to create a logistic function in Excel can greatly enhance your data analysis capabilities. This tutorial provides a comprehensive guide on setting up logistic functions using Excel's built-in features. You'll learn about the economic applications of logistic functions, and walk through practical examples that illustrate the transformation of simple data into insightful logistic models. Gain knowledge on customizing logistic curves to fit specific datasets and scenarios. Create, analyze, and visualize logistic functions effectively using Excel.


